AUVSI USUAS – NCSU Aerial Robotic Club 2012 Resuts

The following details the mission performance of NC State University’s Aerial Robotics Club at the 10th annual AUVSI Student Unmanned Systems competition.

The autopilot successfully executed a fully autonomous take-off before switching over to manual control due to an error in the autopilot’s altitude configuration.  It was later determined to have been operator error caused by improper zeroing of the altitude.  Autonomous control was regained by flying at a higher altitude than originally planned.  The waypoints, search pattern, and emergent target pattern were flown at this fixed altitude.

One special feature added this year was a laser altimeter.  Despite early concerns of a failure, the altimeter performed well through out the mission.

The SRIC message was determined to be:

John Paul Jones, defeated British ship Serapis in the Battle of Flamborough Head on 23 September 1779

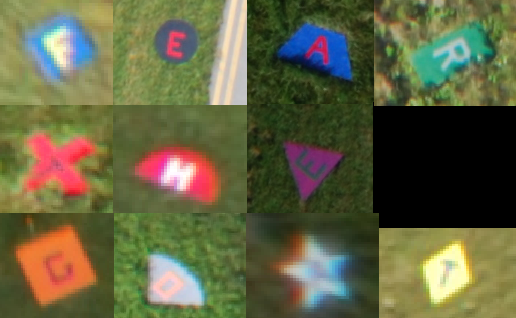
The targets this year spelled out the phrase, “Fear the goat”.  This apparently has something to do with the mascot of the United States Naval Academy “Bill the goat”.

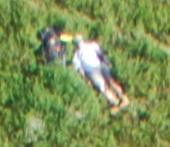
The emergent target this year was a wounded hiker and his backpack.  Most of these details were visible in the images taken with the exception of his wounds.

Automatic Shape Identification

As a result of our win at the AUVSI competition, the members of ARC were invited to the John Hopkins APL Small UAV Symposium.  During the 5 hour drive back up to Maryland, Alex Ray and I discussed the method that the clever guys over at University of Texas at Austin used for automatic shape identification.  Given that we had some time to kill, we decided to try and implement the method ourselves. Detailed here is my attempt.
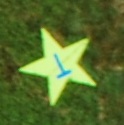
Yellow Star photographed by ARC

Yellow Star photographed by ARC

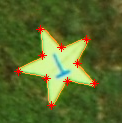
The method begins with a black and white image showing just the shape in question.  For this experiment, black and white images where created as test samples.  Additionally some flight imagery was processed to generate the needed black and white images.  For this example I will process the image below which has been cropped from an image that ARC captured during the competition run.

% Read in the original image
pout = imread(filename);
K = rgb2gray(pout);
% Create a black and white image of the target
K = rgb2gray(pout);
bw = im2bw(K, graythresh(getimage));
bw2 = imfill(bw,'holes');

The above code works effectively on this image to create the needed bw image, however this code will not work on all targets.  Sharp variations in the background and certain target color combinations can ruin the data.  This issue was not further explored because the purpose of this experiment was not finding the targets, but identifying them.  It is assumed that the person using this program would provide a good bw target image.

Using this image an outline of the target is created using the code:

% Find the edge of the object
K = edge(bw2,'sobel');
[K, map] = gray2ind(K,2);

Then the centroid of the object is found using the code:

% Find the centroid
s  = regionprops(bw2, 'centroid');
centroids = cat(1, s.Centroid);

With this data collected it is now possible to generate a signature of the target.  The signature is simply the distance from the centroid of the target to the outer edge.

% Generate the target's signature
dimen = size(K);
counter = 1;
for i=1:dimen(1)
    for k=1:dimen(2)
        if(K(i,k)~=0) % Found an edge point, save the data for this point
                % Distance from centroid
                signature(counter,1) = atan2((centroids(1,2)-i),(centroids(1,1)-k));
                % Angle
                signature(counter,2) = (sqrt((centroids(1,2)-i)^2+(centroids(1,1)-k)^2));
                % Pixel position
                signature(counter,3) = i;
                signature(counter,4) = k;
                counter = counter +1;
        end
    end
end
% Sort the signature data by angle
signature = sortrows(signature);

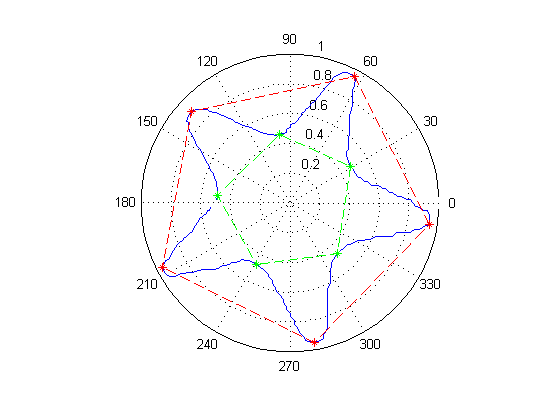
From this point on, the challenge it to determine what the signature corresponds to.  For ease of viewing it is easiest to view the signal as plotted in polar coordinates.  The image below shows the signal generated by the preceding script as a blue line.
data-T

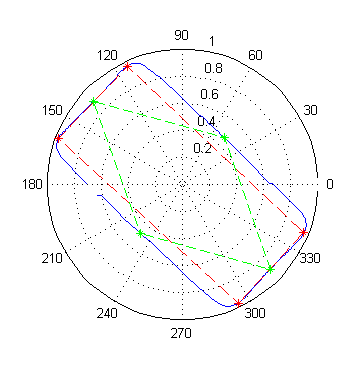
The method used to process theses images tries to find certain features in the signature; in particular, local maximums and minimums.  Maximums indicate the location of an outside corner.  Minimums indicate inside corners or the midpoints of lines that run past the centroid.  A straight line will appear to get closer and closer to the centroid until it reaches a minimum and then begins to move away.  In the case of the star all minimums are inside corners, but in the rectangle shown below, all minimums are the result of lines passing by the centroid.
data-L

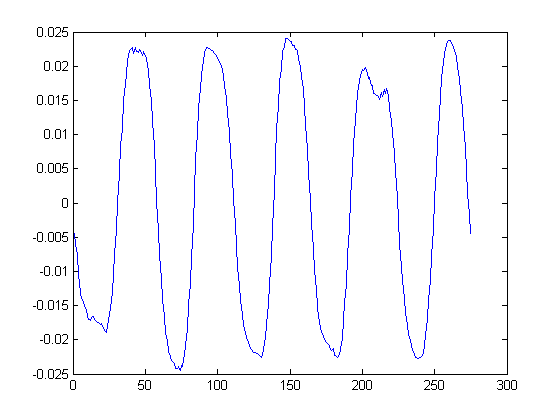
To find these points the instantaneous rate of change between each consecutive pair must first be calculated.  This produces the below chart shown in Cartesian coordinates.  Critical points are located at each point where the plot crosses the x axis.  This point can be easily located by checking for a sign change.
 

diff-T

Once the critical points have been located it is simply a matter of classifying the target.  Circles are filtered out first by looking for cases where the max and min of the signature are very close together. Next, the classifier discriminates based on the number of critical points.  This will be the final step for ovals and triangles.  For the other shapes a comparison of the  average maximum and minimum points values are compared.  Star like shapes will have a much greater difference than regular shapes.  Quadrilaterals undergo an additional check to compare the values of consecutive maximums.  A large difference will indicate a diamond shape.

When run against a set of seven artificial targets, the method correctly identifies every shape.  Running against the real image set sees excellent results as well.  Moving forward it will be important to expand the data set to include more real images.  There are some enhancements to the current algorithm that may make it more robust.  It would also be interesting to explore the application of a neural net in solving the signature identification.   One final advantage to this algorithm is speed.  When just asked to determine the shape, the star image can be processed in less than half a second.
processedT

I’ve made the code available here as a download.  It requires the use of the Mathworks Image Processing Toolbox to work, which I don’t have anymore, so the code is provided as is without testing.

TargetID
EagleView – 24 Hr Imagery System Challenge

Motivation

Last year at the 2009 AUVSI Student UAS competition the aerial robotics club (ARC) arrived with an imagery system that was in poor shape to say the least.  The cause of this had more to do with a lack of man power than anything else, so any semblance of a system at all was a miracle in itself.  Software was still being written the night before and so the system had never been put through a full flight test before the competition run.  A last minute change at the flight line disabled the flight computer and caused a panic until it was identified.  When the GPS failed at the flight line, it sealed the death of the system.

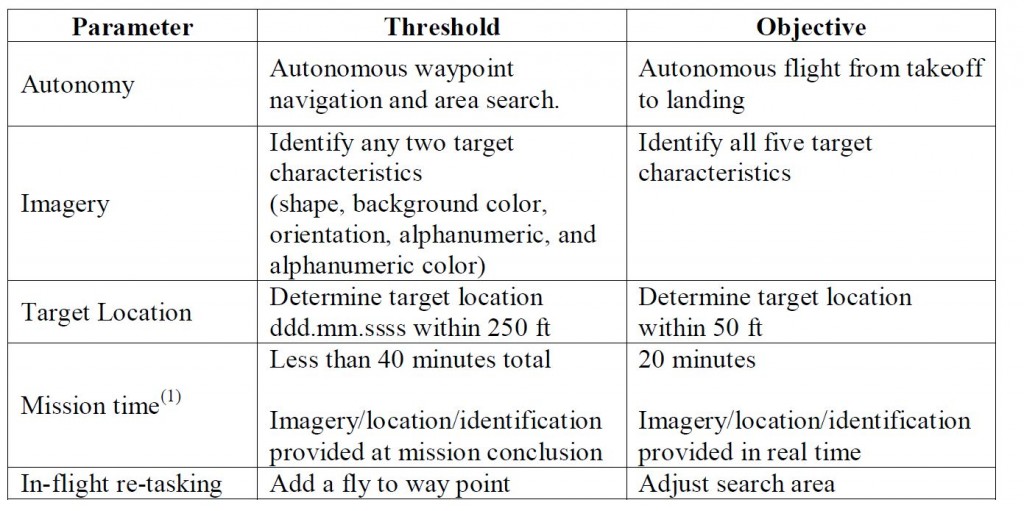
threshold

This year’s rules included a very clear chart (shown above) detailing what the team’s systems would be expected to do and what things should be worked towards.  However, as of now, the imagery team’s software is unable to meet any of the thresholds in the manner it was designed to.  The viewer crashes due to a memory leak, which may require it to be completely rebuilt.  But, even if that issue could be patched the system still lacks the capability for the operator to enter target information and the mechanism to deliver the information to the judges in the proper format is missing.  While none of these challenges are insurmountable they are none the less still significant enough to prevent the overall team from performing a full competition simulation this weekend.  With just three weeks till competition this is a serious problem.

With the system in the state it is, and the memory of last year’s failures still fresh, I decided it was time to cut through the club politics and do something about the problem.

The Challenge

Design, build, and test software  such that it meets the following criteria

  • Complete all of the competition thresholds for imagery
  • Do not require any significant changes to the current imagery system
  • Be portable and flexible so that it can be easily implemented
  • Be complete in less than 24 hours after the beginning of the challenge

Results

The resulting software is written in Matlab.  The resulting code can be compiled into an executable that can be run on any modern windows system without a need for matlab to be installed or for an internet connection to be present.  The software utilizes Matlab’s image processing library which is available in the campus computer labs or over VCL.

Crop

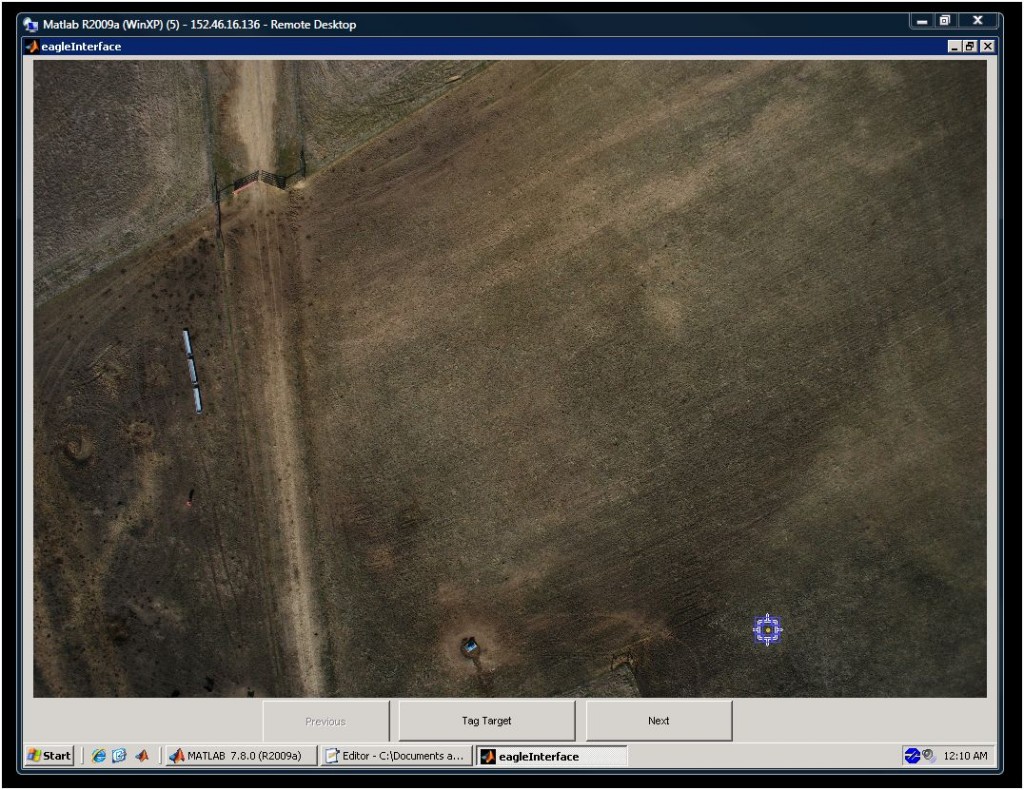
The screenshot above shows the software running over a remote connection to the virtual computing lab (VCL).  Despite the slow connected the software still performs adequately.  The screenshot shows the basic interface of EagleView.  The “Previous” and “Next” buttons on the bottom allow the operator to browse the images that have arrived from the aircraft.  If a previous or next image is not available, then the button is disabled.  This feature is continuously updated so that the operator can always advance if there is an image to advance to.  The architecture at this point makes two assumptions.  Pictures are not removed or renamed once in the pictures directory and that new pictures are added to the end of the directory’s listing.  Both of these assumptions are currently valid for ARC’s system.
When a potential target is spotted, the operator can click on the “Tag Target” button.  This allows the operator to draw a box around the object.  By then right-clicking and selecting “Crop Image” the operator can advance to the next stage of tagging.
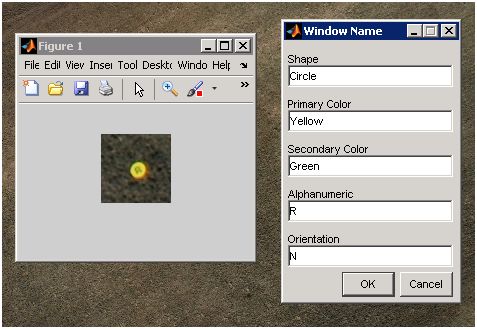
The operator is presented with two new windows.  The first shows the object in question in greater detail.  The image seen here will be saved to the results directory which will be given to the judges at the conclusion of the competition run.  The second window provides fields for the operator to fill in the details.  When the operator is satisfied and clicks the “Ok” button, the results are immediately saved off to a text file.  This text file conforms to the specifications as provided by the judges.  This process can be done for as many images and targets as needed.  Inspection of the results has shown that the GPS evaluation of the pixels merits additional work, it is still indeterminate whether the error is resulting from the program or from poor sensor data.  However the GPS results are still good enough to place a target within the 120 foot threshold.
Conclusions
The software has met all of the goals set out by the challenge.  The challenge was begun at 12:15 AM on May 28th and concluded at 11:30 PM the same day.  As a single image viewer the software omits the ability to show the operator where imagery data may be missing.  This can be overcome by using another Matlab based program called kmLive.  Using code developed by Dan Edwards, I modified the program to continuously monitor a directory and generate a corresponding kml document.  The program Google Earth can then link to this file using a “Network Link” which can be configured to continuously monitor the file for updates.  This gives the operator a real-time mosaic which is greatly useful in seeing areas with inadequate imagery coverage.  The rate at which pictures arrive (~ once every 3 seconds) and the rate at which Google Earth can process them (slightly less than 3 seconds on my old laptop) may reduce the usefulness of this as a tool for searching for targets.  Actual performance will vary greatly depending on hardware capabilities.
In the end I am very glad that I undertook this challenge.  With over 17 hours of work put in, I am very exhausted.  Not knowing how to program GUIs with Matlab made the first five hours extremely frustrating.

The screenshot above shows the software running over a remote connection to the virtual computing lab (VCL).  Despite the slow connected the software still performs adequately.  The screenshot shows the basic interface of EagleView.  The “Previous” and “Next” buttons on the bottom allow the operator to browse the images that have arrived from the aircraft.  If a previous or next image is not available, then the button is disabled.  This feature is continuously updated so that the operator can always advance if there is an image to advance to.  The architecture at this point makes two assumptions.  Pictures are not removed or renamed once in the pictures directory and that new pictures are added to the end of the directory’s listing.  Both of these assumptions are currently valid for ARC’s system.

When a potential target is spotted, the operator can click on the “Tag Target” button.  This allows the operator to draw a box around the object.  By then right-clicking and selecting “Crop Image” the operator can advance to the next stage of tagging.

tagging

The operator is presented with two new windows.  The first shows the object in question in greater detail.  The image seen here will be saved to the results directory which will be given to the judges at the conclusion of the competition run.  The second window provides fields for the operator to fill in the details.  When the operator is satisfied and clicks the “Ok” button, the results are immediately saved off to a text file.  This text file conforms to the specifications as provided by the judges.  This process can be done for as many images and targets as needed.  Inspection of the results has shown that the GPS evaluation of the pixels merits additional work, it is still indeterminate whether the error is resulting from the program or from poor sensor data.  However the GPS results are still good enough to place a target within the 120 foot threshold.

As a single image viewer the software omits the ability to show the operator where imagery data may be missing.  This can be overcome by using another Matlab based program called kmLive.  Starting with code developed by Dan Edwards, I created kmLive to continuously monitor a directory of aerial imagery and generate a corresponding kml document.  The program Google Earth can then link to this file using a “Network Link” which can be configured to continuously monitor the file for updates.  This gives the operator a real-time mosaic which is greatly useful in seeing areas with inadequate imagery coverage.  The rate at which pictures arrive (~ once every 3 seconds) and the rate at which Google Earth can process them (slightly less than 3 seconds on my old laptop) may reduce the usefulness of this as a tool for searching for targets.  Actual performance will vary greatly depending on hardware capabilities.

Conclusions

The software has met all of the goals set out by the challenge.  The challenge was begun at 12:15 AM on May 28th and concluded at 11:30 PM the same day.  In the end I am very glad that I undertook this challenge.  With over 17 hours of work put in, I am very exhausted.  Not knowing how to program GUIs with Matlab made the first five hours extremely frustrating.  I look forward to seeing where this project goes in the future.  At only 523 lines the program is fairly short and relatively simple.  This leaves the door for future expansion wide open.

Automatic Shockwave Identification

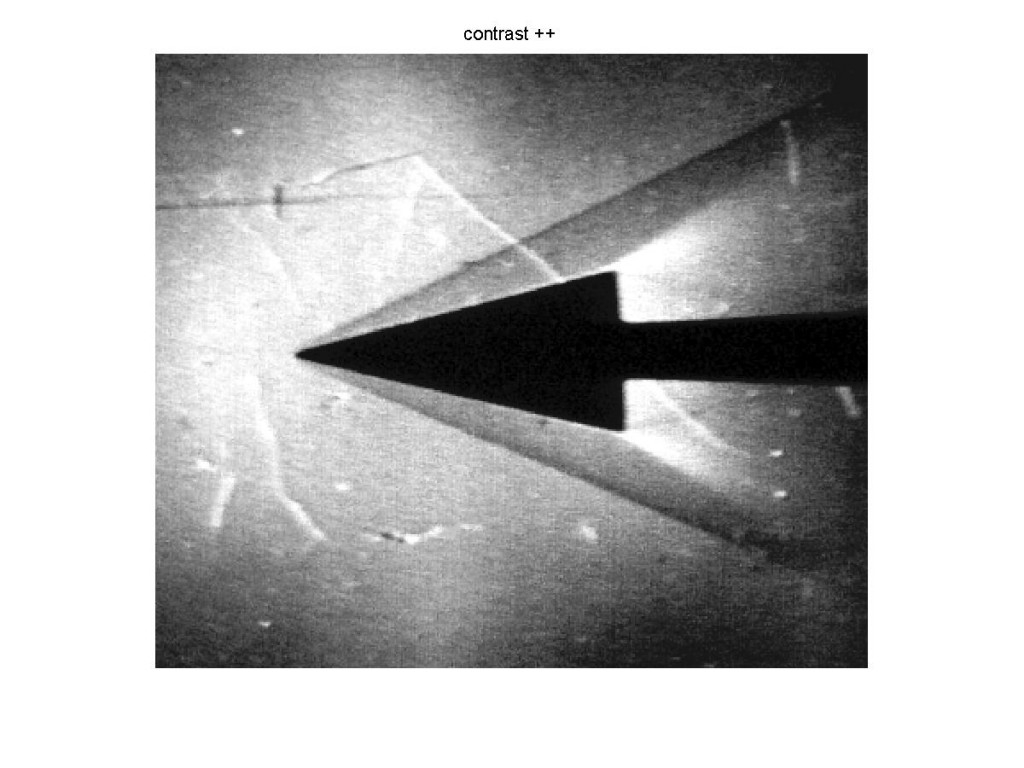
The following project spawned from a simple homework assignment. The purpose of the assignment was to identify the angle of the shock-wave formed on an object. Provided were photographs from the schlieren visualization lab that we had done the previous week. What I have written is a matlab script that finds the finds the shock-wave and draws a line on it. From the beginning and ending points the angle can easily be discerned. What follows is the progression of images produced as the various processes and filters are applied to the image.

Grayscale + Contrast

Grayscale + Contrast

The image is first converted to grayscale. The contrast is then increased.

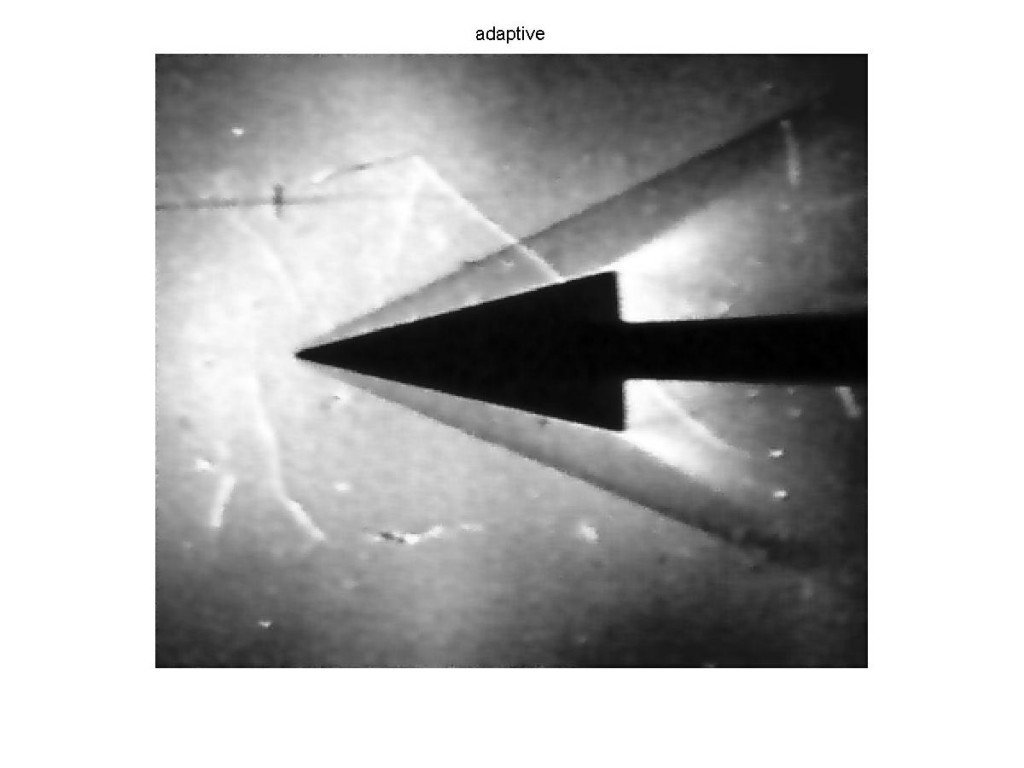
Smoothing

Smoothing

The increased contrast has also made the image more grainy. The image is smoothed using and adaptive filter to reduce the number of fake lines that will be detected in the next step.

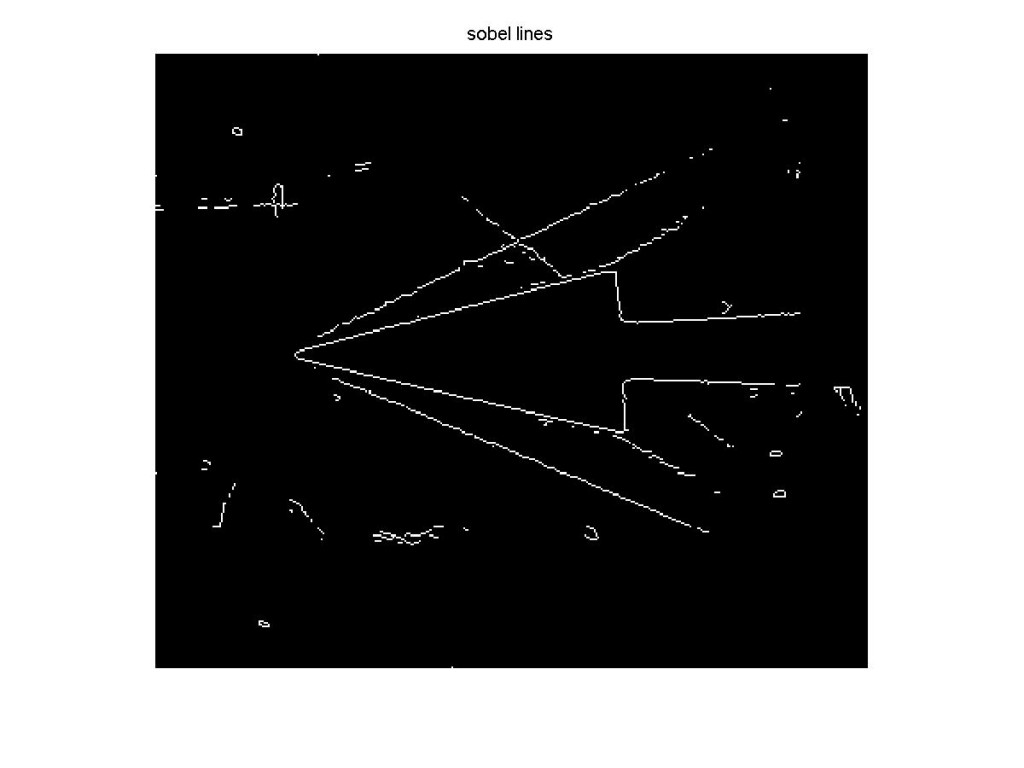
Edge Finding

Edge Finding

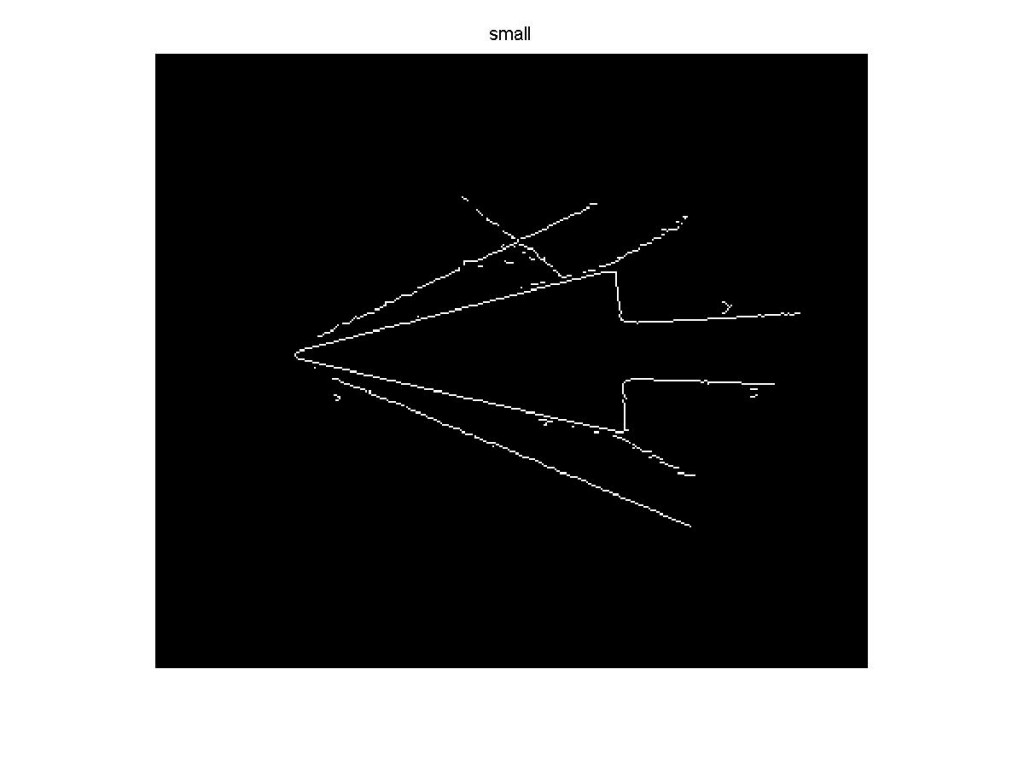
An edge finding algorithm is applied which looks for sharp changes in the color of the image. This creates a binary image (black and white) where only the edges are shown.

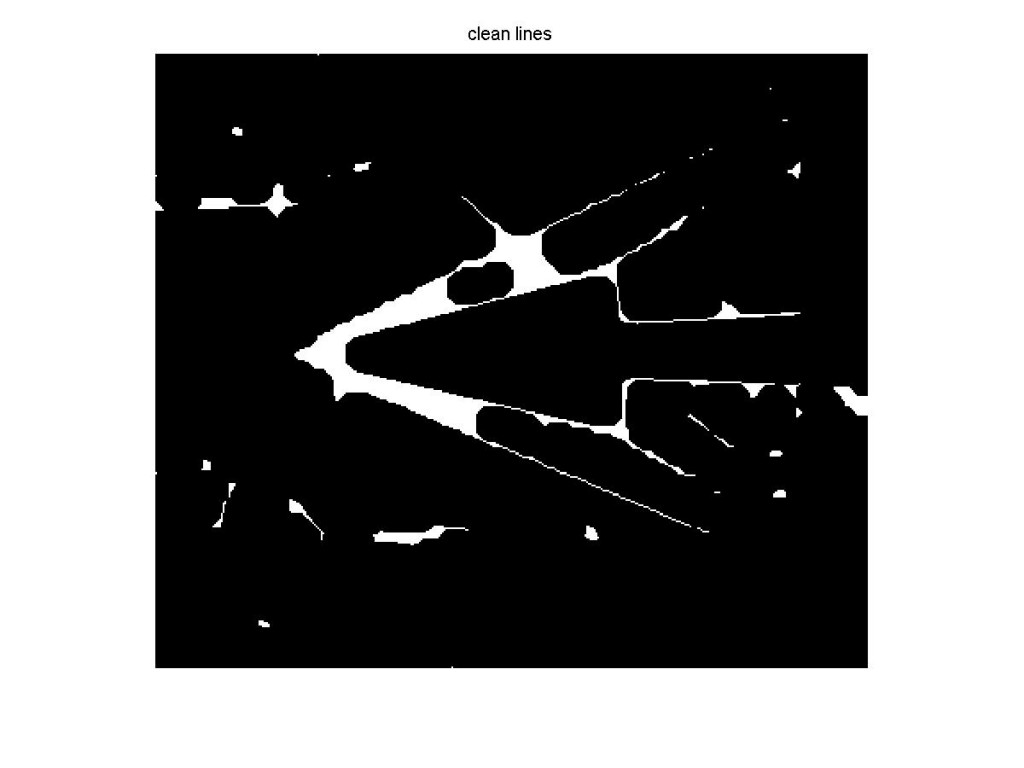
Merge Lines

Merge Lines

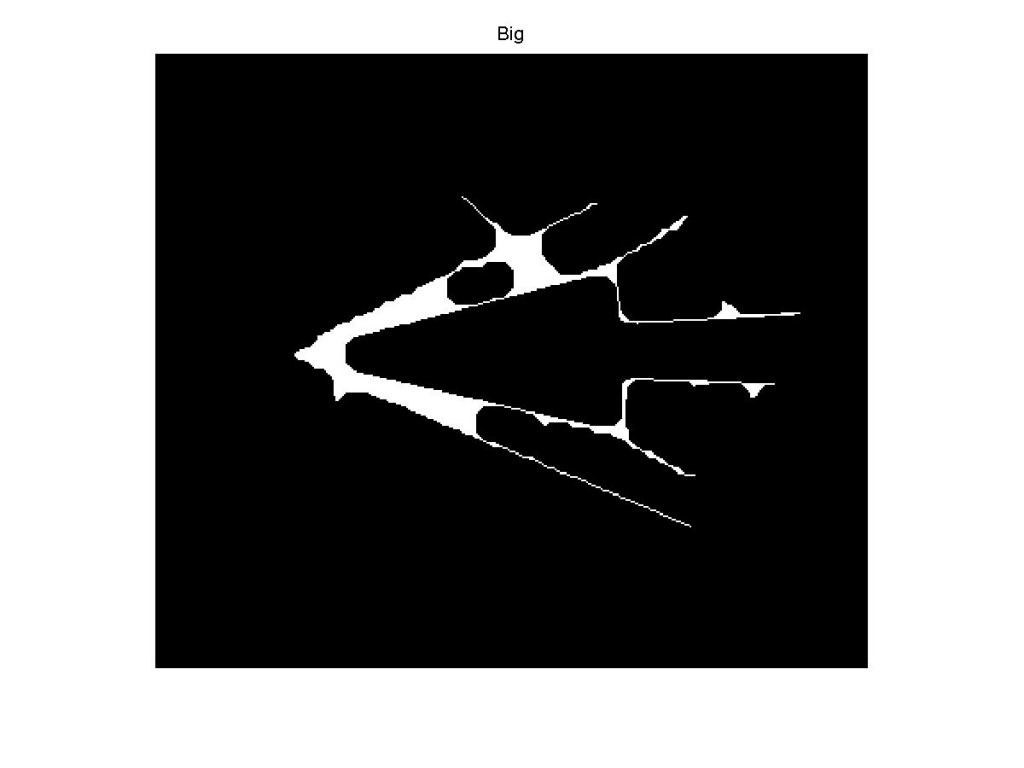
In this step we want to retain the object which created the shock-waves as well as the shock-waves. The object has an unbroken outline making it the largest contiguous object in the image. We also know that the shock-wave will be mostly contiguous and will importantly come very close to the object. A region closing algorithm is applied to the image which causes the regions to expand and merge together.

Isolate Large Object

Isolate Large Object

Now the largest contiguous region can be selected from the image.

Line Fragments Filtered

Line Fragments Filtered

This is used as a filter against the image from step 3.

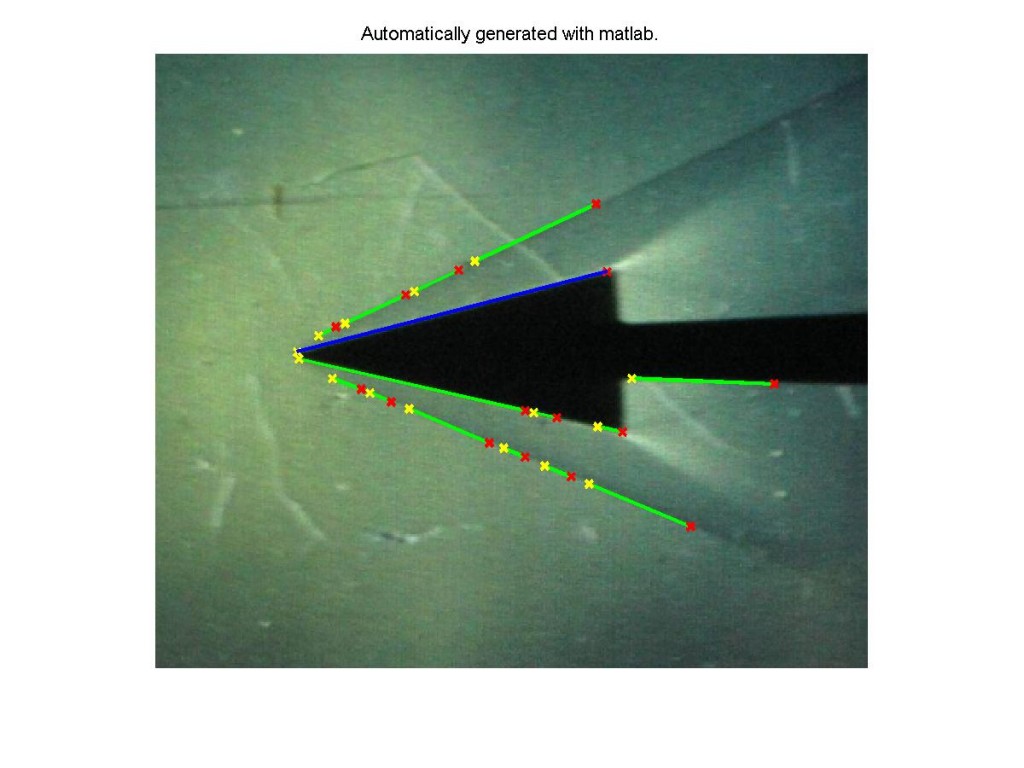
Hough Transformation to find Lines

Hough Transformation to find Lines

At this point a hough transform is applied to the image. From this the “houghlines” function extracts end-points for lines. Finally this data is over-layed on to the original image.  There is also a bit of code at the end for collating multiple lines along the same feature into a single item on a list.  The plan was to use this list to find shock-waves and their angles.

There are a number of areas where this experiment could be expanded. Importantly, the algorithm needs to run against other images to in order to tune out oddities that are likely to occur. The code itself could be generalized so that it is easier to hand it new information. The data generated could also be processed better to amalgamate discontinuous lines. This was started, but never completed. There is also the possibility of adding a method to cut-out the object that generated the shockwaves from the images. This could be useful for reducing the irrelevant lines that are generated.

I have appended the original code I used for this below.  Be advised that the code is very rough in spots and has no comments.  This code will not work without matlab’s image processing libraries.

Matlab Shockwave

Return top