EagleView – 24 Hr Imagery System Challenge

Motivation

Last year at the 2009 AUVSI Student UAS competition the aerial robotics club (ARC) arrived with an imagery system that was in poor shape to say the least.  The cause of this had more to do with a lack of man power than anything else, so any semblance of a system at all was a miracle in itself.  Software was still being written the night before and so the system had never been put through a full flight test before the competition run.  A last minute change at the flight line disabled the flight computer and caused a panic until it was identified.  When the GPS failed at the flight line, it sealed the death of the system.

threshold

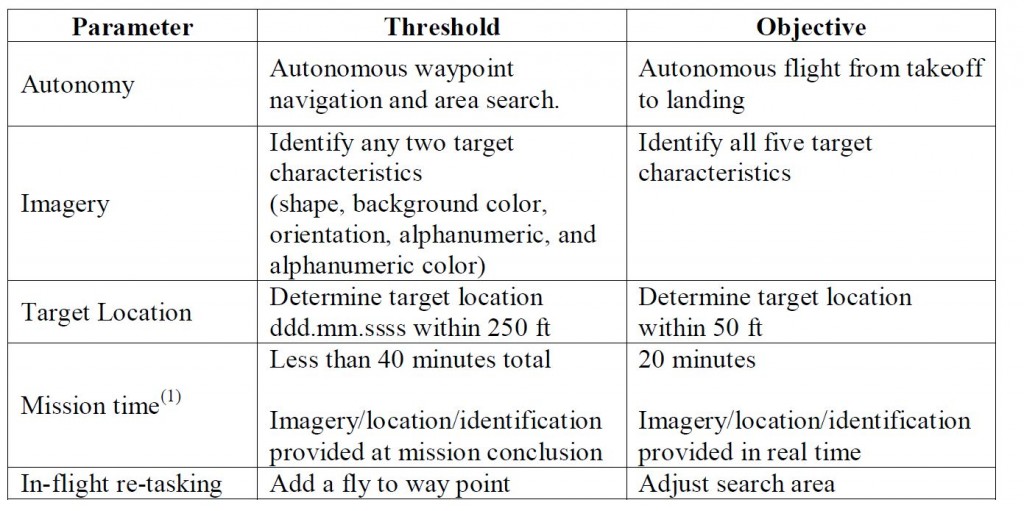
This year’s rules included a very clear chart (shown above) detailing what the team’s systems would be expected to do and what things should be worked towards.  However, as of now, the imagery team’s software is unable to meet any of the thresholds in the manner it was designed to.  The viewer crashes due to a memory leak, which may require it to be completely rebuilt.  But, even if that issue could be patched the system still lacks the capability for the operator to enter target information and the mechanism to deliver the information to the judges in the proper format is missing.  While none of these challenges are insurmountable they are none the less still significant enough to prevent the overall team from performing a full competition simulation this weekend.  With just three weeks till competition this is a serious problem.

With the system in the state it is, and the memory of last year’s failures still fresh, I decided it was time to cut through the club politics and do something about the problem.

The Challenge

Design, build, and test software  such that it meets the following criteria

  • Complete all of the competition thresholds for imagery
  • Do not require any significant changes to the current imagery system
  • Be portable and flexible so that it can be easily implemented
  • Be complete in less than 24 hours after the beginning of the challenge

Results

The resulting software is written in Matlab.  The resulting code can be compiled into an executable that can be run on any modern windows system without a need for matlab to be installed or for an internet connection to be present.  The software utilizes Matlab’s image processing library which is available in the campus computer labs or over VCL.

Crop

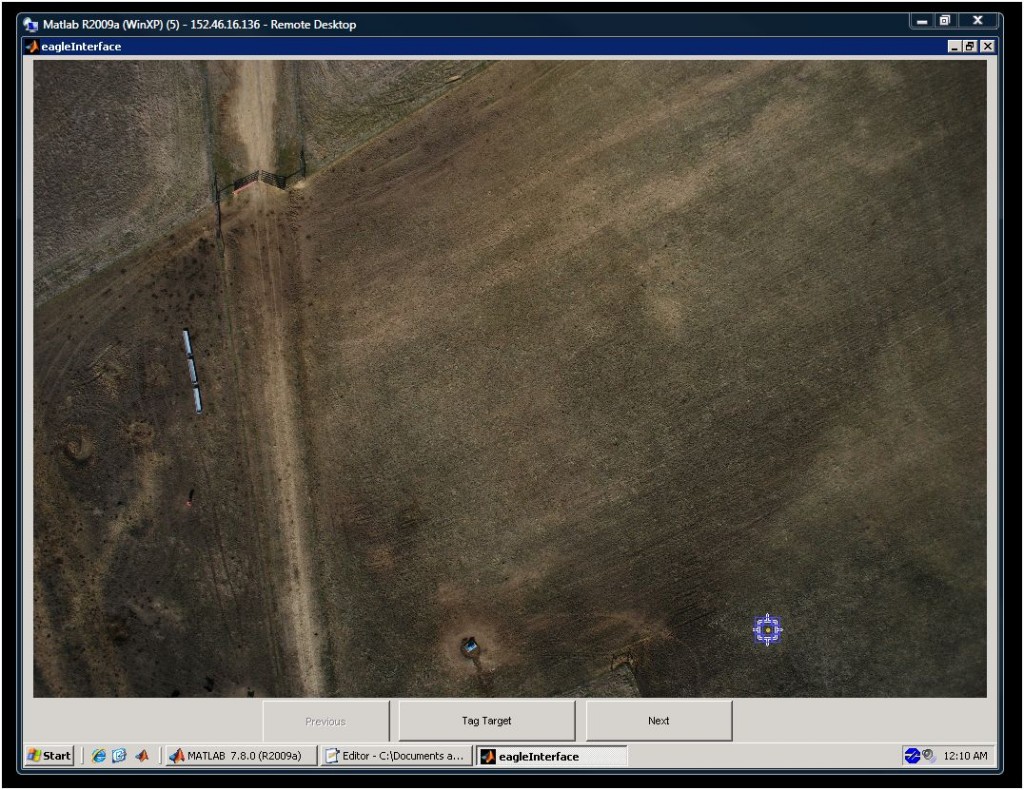
The screenshot above shows the software running over a remote connection to the virtual computing lab (VCL).  Despite the slow connected the software still performs adequately.  The screenshot shows the basic interface of EagleView.  The “Previous” and “Next” buttons on the bottom allow the operator to browse the images that have arrived from the aircraft.  If a previous or next image is not available, then the button is disabled.  This feature is continuously updated so that the operator can always advance if there is an image to advance to.  The architecture at this point makes two assumptions.  Pictures are not removed or renamed once in the pictures directory and that new pictures are added to the end of the directory’s listing.  Both of these assumptions are currently valid for ARC’s system.
When a potential target is spotted, the operator can click on the “Tag Target” button.  This allows the operator to draw a box around the object.  By then right-clicking and selecting “Crop Image” the operator can advance to the next stage of tagging.
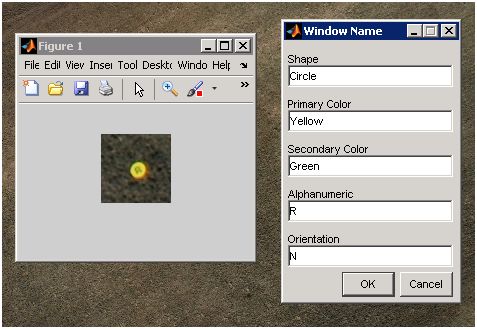
The operator is presented with two new windows.  The first shows the object in question in greater detail.  The image seen here will be saved to the results directory which will be given to the judges at the conclusion of the competition run.  The second window provides fields for the operator to fill in the details.  When the operator is satisfied and clicks the “Ok” button, the results are immediately saved off to a text file.  This text file conforms to the specifications as provided by the judges.  This process can be done for as many images and targets as needed.  Inspection of the results has shown that the GPS evaluation of the pixels merits additional work, it is still indeterminate whether the error is resulting from the program or from poor sensor data.  However the GPS results are still good enough to place a target within the 120 foot threshold.
Conclusions
The software has met all of the goals set out by the challenge.  The challenge was begun at 12:15 AM on May 28th and concluded at 11:30 PM the same day.  As a single image viewer the software omits the ability to show the operator where imagery data may be missing.  This can be overcome by using another Matlab based program called kmLive.  Using code developed by Dan Edwards, I modified the program to continuously monitor a directory and generate a corresponding kml document.  The program Google Earth can then link to this file using a “Network Link” which can be configured to continuously monitor the file for updates.  This gives the operator a real-time mosaic which is greatly useful in seeing areas with inadequate imagery coverage.  The rate at which pictures arrive (~ once every 3 seconds) and the rate at which Google Earth can process them (slightly less than 3 seconds on my old laptop) may reduce the usefulness of this as a tool for searching for targets.  Actual performance will vary greatly depending on hardware capabilities.
In the end I am very glad that I undertook this challenge.  With over 17 hours of work put in, I am very exhausted.  Not knowing how to program GUIs with Matlab made the first five hours extremely frustrating.

The screenshot above shows the software running over a remote connection to the virtual computing lab (VCL).  Despite the slow connected the software still performs adequately.  The screenshot shows the basic interface of EagleView.  The “Previous” and “Next” buttons on the bottom allow the operator to browse the images that have arrived from the aircraft.  If a previous or next image is not available, then the button is disabled.  This feature is continuously updated so that the operator can always advance if there is an image to advance to.  The architecture at this point makes two assumptions.  Pictures are not removed or renamed once in the pictures directory and that new pictures are added to the end of the directory’s listing.  Both of these assumptions are currently valid for ARC’s system.

When a potential target is spotted, the operator can click on the “Tag Target” button.  This allows the operator to draw a box around the object.  By then right-clicking and selecting “Crop Image” the operator can advance to the next stage of tagging.

tagging

The operator is presented with two new windows.  The first shows the object in question in greater detail.  The image seen here will be saved to the results directory which will be given to the judges at the conclusion of the competition run.  The second window provides fields for the operator to fill in the details.  When the operator is satisfied and clicks the “Ok” button, the results are immediately saved off to a text file.  This text file conforms to the specifications as provided by the judges.  This process can be done for as many images and targets as needed.  Inspection of the results has shown that the GPS evaluation of the pixels merits additional work, it is still indeterminate whether the error is resulting from the program or from poor sensor data.  However the GPS results are still good enough to place a target within the 120 foot threshold.

As a single image viewer the software omits the ability to show the operator where imagery data may be missing.  This can be overcome by using another Matlab based program called kmLive.  Starting with code developed by Dan Edwards, I created kmLive to continuously monitor a directory of aerial imagery and generate a corresponding kml document.  The program Google Earth can then link to this file using a “Network Link” which can be configured to continuously monitor the file for updates.  This gives the operator a real-time mosaic which is greatly useful in seeing areas with inadequate imagery coverage.  The rate at which pictures arrive (~ once every 3 seconds) and the rate at which Google Earth can process them (slightly less than 3 seconds on my old laptop) may reduce the usefulness of this as a tool for searching for targets.  Actual performance will vary greatly depending on hardware capabilities.

Conclusions

The software has met all of the goals set out by the challenge.  The challenge was begun at 12:15 AM on May 28th and concluded at 11:30 PM the same day.  In the end I am very glad that I undertook this challenge.  With over 17 hours of work put in, I am very exhausted.  Not knowing how to program GUIs with Matlab made the first five hours extremely frustrating.  I look forward to seeing where this project goes in the future.  At only 523 lines the program is fairly short and relatively simple.  This leaves the door for future expansion wide open.
First PCBs

I just sent out my first PCBs for fabrication at batchpcb.com.  The first board is simply a Sparkfun breakout board for the WiFly.  As it turns out, it is cheaper to buy  the WiFly from another company and then pay to have a custom breakout board made, than it is to buy the combined assembly from Sparkfun.  However, this method does take more time, and requires more tools, but that is half the fun!

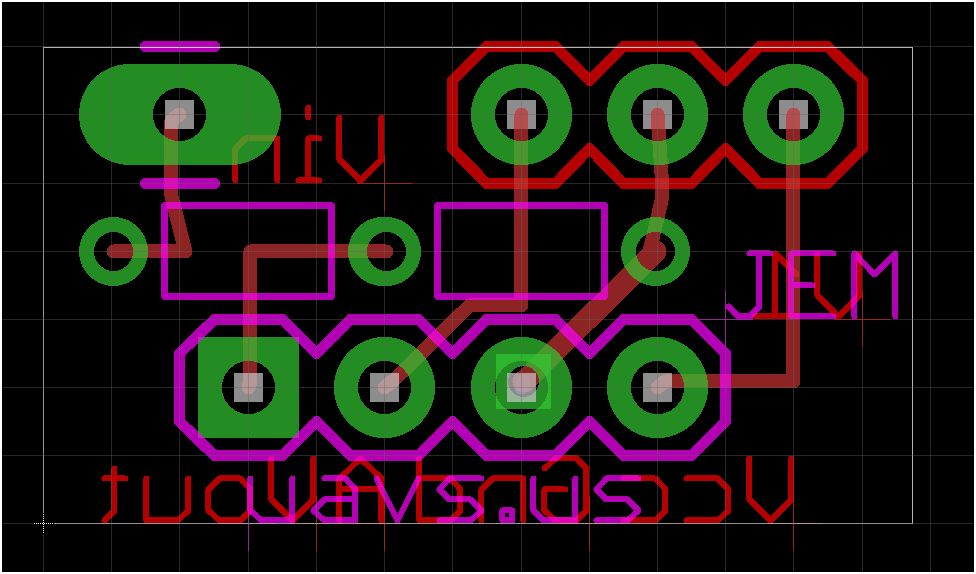
The second board is more interesting.  The Wattmeter Plug-in I wrote for the Piccolo requires a special sensor board to provide the voltage and current data to the Piccolo.  Originally this was made for a system that already had that component, so I didn’t need to do any work with that part.  Since every  PCB order comes with a $10 handling fee and the WiFly breakout only cost $5, I decided to make an attempt at making my own sensor board.

VCsensor

Simply named the VCsensor, the board is all through-hole components, mostly because that is what I have available. The board came out quite compact at less than one square inch which makes it cheaper to have fabricated.  When the boards come in I’ll find out the results of my first experiment in PCB fabrication.

Quadrotor

I’ve wanted to build a quadrotor for a long time now.  Not only is it an interesting controls project, but it can go places that few other air vehicles can.  It has the potential to carry substantial payloads opening the door for some powerful on-board computing.  In starting this project I decided to start from scratch with everything because my goal is not to simply have a quadrotor (anyone with enough money can do that).  I wanted to go through the exercise of developing a substantial control system and code base.  When the project gets further along I will likely switch to an open protocol for my data transfer, but the all important control code will always be my own.

The project started about one year ago with a slightly different intent.  The goal was to design a quadrotor frame that would be statically stable and damped enough that the pilot could fly it.  The idea was that a large weight below the plane of the rotors would act like a pendulum which would right the vehicle.  After building the vehicle I tested it by suspending the frame so that it was free to rotate.  Because the point at which it was suspended was above the CG (thanks to the 2 pound weight on the bottom) the vehicle appeared to be statically stable.

However, even with this crutch, the vehicle was still impossible to keep level due to the dynamic instability.  In the end the concept was abandoned and the parts for an inertial measurement unit were ordered.  The sensors included a 3-axis accelerometer and three single axis gyros.  The sensors were carefully assembled orthographically to each other.  Unfortunately I found out the hard way that the analog pins default to outputing, thus my 5 volt Sanguino fried all of my sensors.  This accident ended the project for that summer.  It wasn’t until January of this year that the advent of Sparkfun’s 9 DOF that  the project was resumed.

The original frame was put to use and was rechristened the Cakecopter since all of the electronics were housed in a Harris Teeter cake tin.  Most of the core development occured over the course of about a week and a half.  The vehicle reached the point where it was able to do short hovers (~5 seconds) within a small area.  Sadly during one such test the vehicle had a hard landing in such a way that it broke both of the counterclockwise (CCW) rotating props.  This wouldn’t have been a problem except that the only props I have ever broken on this project have been CCW, so despite having ordered three full sets of blades I was out of replacements.

DSCN0122

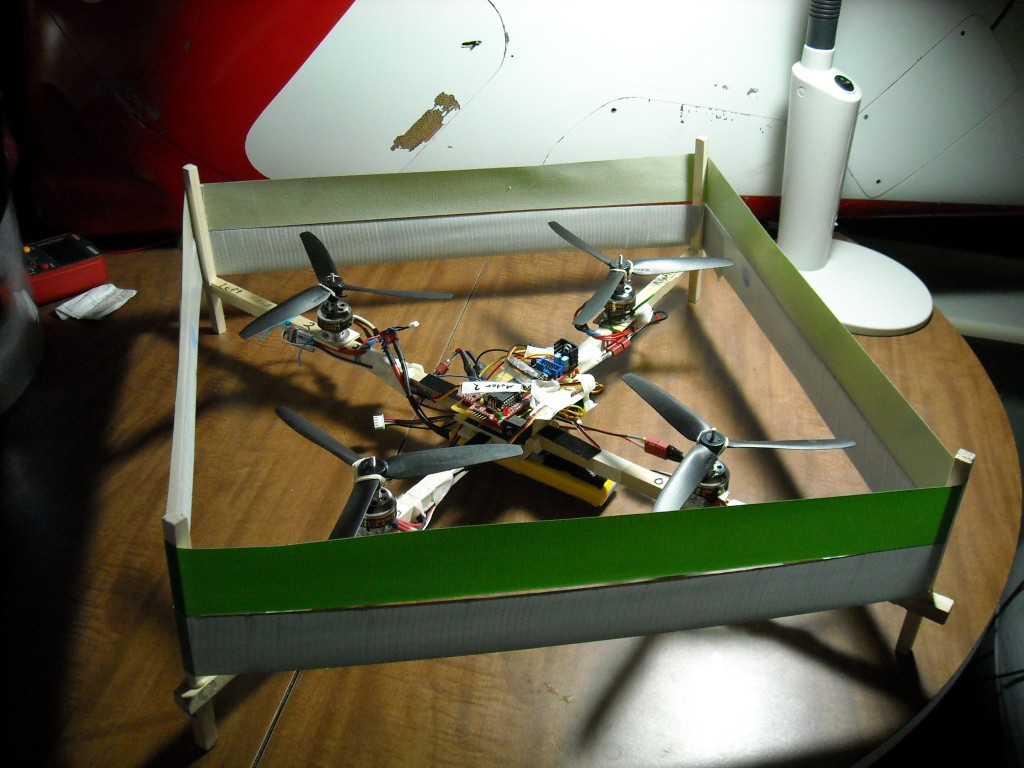
Having anticipated this challenge during the early flight tests I had order four sets of small tri-bladed props as a backup.  Unfortunately, the new props did not generate nearly as much thrust as the single bladed props, so the frame had to be redesigned to reduce weight.  The new frame (unnamed as of yet) is lighter, more compact, and allows for a full enclosure for the blades.  The current configuration uses a duct tape band to keep things away from the prop.  I did cut a soft foam block to serve as protection (as well as make the vehicle look awesome), but it ended up being far to heavy for the vehicle.  The foam has since been re-purposed as the body for the Broughton-Moving-Monster.

Retuning the PID gains for this new body took much less time than for the Cakecopter.  During the last flight test the vehicle showed static and dynamic stability, but a low battery prevented enough thrust for lift-off.  When a fresh battery was added one of the motor controllers died.  I am now awaiting the replacement part which should arrive sometime in the next few days.

New URL

At long last I have found a URL worth having.  The new URL is uavs.us which stands for Unmanned Aerial Vehicle Systems, or UAVs.

The processing of ordering a redirecting the URL to my server took a few hours.  Getting wordpress to play along was much more difficult.  Upon getting the URL forwarded to my server I tried to access wordpress the same way I had been accessing it and then at the new address:

Old: 74.183.253.9/wordpress/

New: uavs.us/wordpress/

While the old method still worked, the new address just gave me an error saying that

The config file for the specified host is not under an allowed path

It took me far too long to figure out a solution to this problem.  The root of the issue is that I use an Ubuntu based server and installed wordpress using apt-get.  The publisher of the package improved the software making the wp-config.php file “highly customized” according to one source.  In the end, the solution turned out to be that while I have a single file called “config-74.183.253.9.php”, I needed a file to correspond to each of the addresses that might need to connect to wordpress. Thus I had to use the commands:

sudo cp config-74.183.253.9.php config-uavs.us.php

sudo cp config-74.183.253.9.php config-www.uavs.us.php

This fixed the issue for me.  The issue could also have been solved by editing the wp-config.php file such that it will only look for the one file.

fractal01

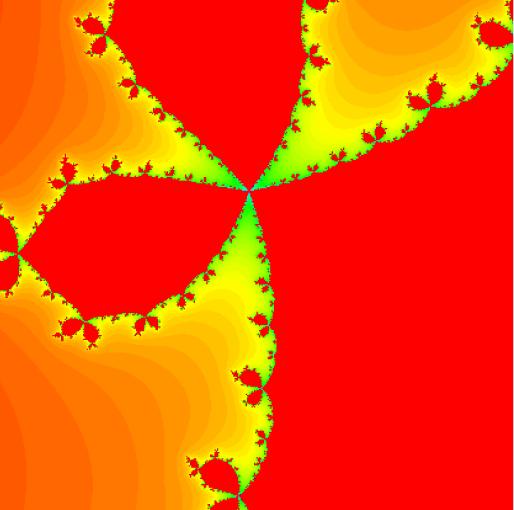
An old picture I generated, posted using the repaired content upload

Having gotten wordpress up and running again I decided to also perform some server maintenance.  Now wordpress is the homepage for uavs.us instead of being at /wordpress.  Finally, I fixed a back-end issue which fixed the mechanism for adding media to these posts.  The consequence is that I will have to repost all the old pictures, but in the future it will be much easier to add content.

New Plug-in for Roll Pitch Gimbal

Besides the Piccolo autopilot Cloud Cap makes another product called the TASE.  This system is built around a pan-tilt (PT) camera that can be mounted on an UAV.  The system can be closely integrated with the Piccolo Command Center allowing the user to quickly redirect the camera.  This system costs as much as a new Piccolo autopilot and as such was disregarded by the Aerial Robotics Club for whom I am writing this plug-in for.

However, the software to integrate with the gimbal is available at no additional cost to control a PT gimbal.  Thus the plan became to write a plug-in that would make adapt the commands for a PT gimbal to a roll-pitch (RP) gimbal.  This plan of action was pursued for about two months and the software was unavailable at three test flight days.

Finally,  I came to my senses and realized that I could make a much more simple plug-in that would satisfy all the requirements of the user.  The only feature gained by going through the TASE software was the ability to right-click on the main map and redirect the gimbal to lock to a GPS location.  Having removed this feature I was able to write a preliminary version in a mere two hours.

RP-Gimbal

As shown above, the preliminary version successfully implements the two features shown with white buttons.  The stow button commands the gimbal to a position that puts the lens as far from the ground as possible; helpful during rough landings.  The Nadir button points the camera straight down for taking orthographic pictures of the ground.  A text field shown on the bottom half is used only for debugging purposes and will not be included in the final product.

The Angle, Offset, and Orbit features were not implemented, but will require only a modest time commitment to make work.   The arrow will gives the user a graphical feed-back of the current roll of the gimbal relative to the earth.  The “Auto-stow” feature is also another to-do list item.  This feature will automatically unstow the gimbal when the aircraft is in a “flying” state and keep it stowed for all other portions of the flight (preflight, take-off, and landing).

This feature is more then adequate for all the competition and testing purposes.  The Nadir feature is allows for imaging the search area.  The Angle and Offset features allow for photographing an off-center target.  The Orbit feature allows simple targeting of the “Pop-up” target.  It can be noted that these features still exceed the requirements, as the last three features all do essentially the same thing (off-axis pointing).  However, all will be included because their inclusion is not time-consuming and will reduce the operator’s workload greatly.

In this discussion I have neglected to comment on the Adapter and GPS buttons.  Although the project has gone in a new direction it would be interesting to see advanced features included.  In time these will likely be removed as vestigial code.

Automatic Shockwave Identification

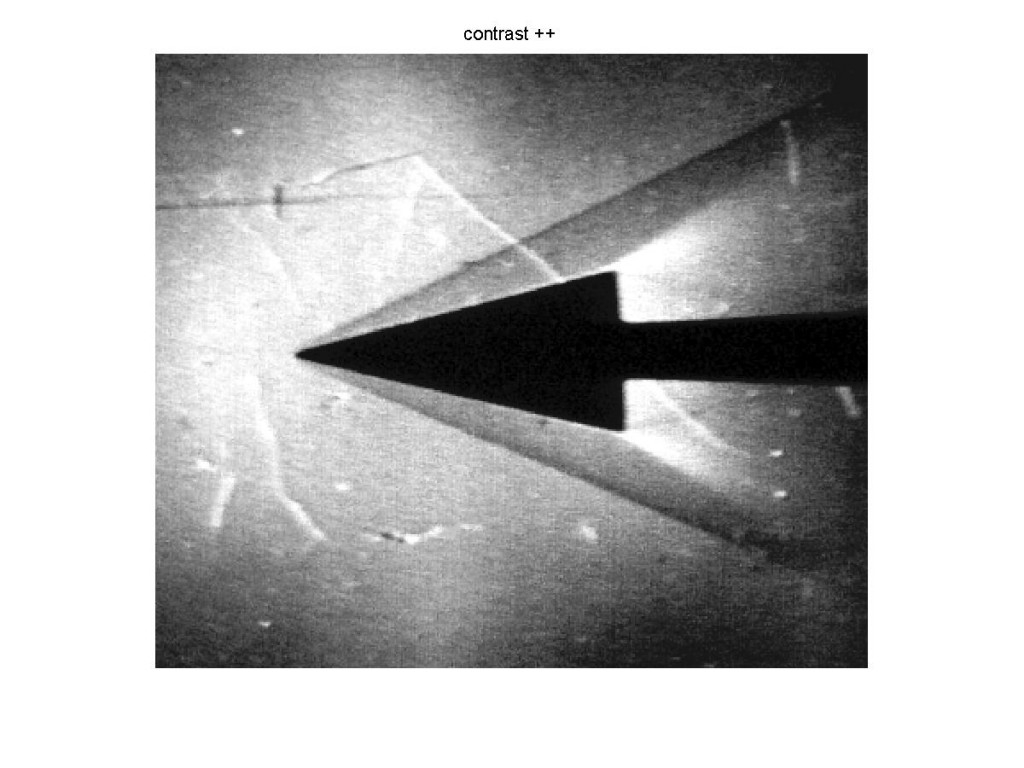
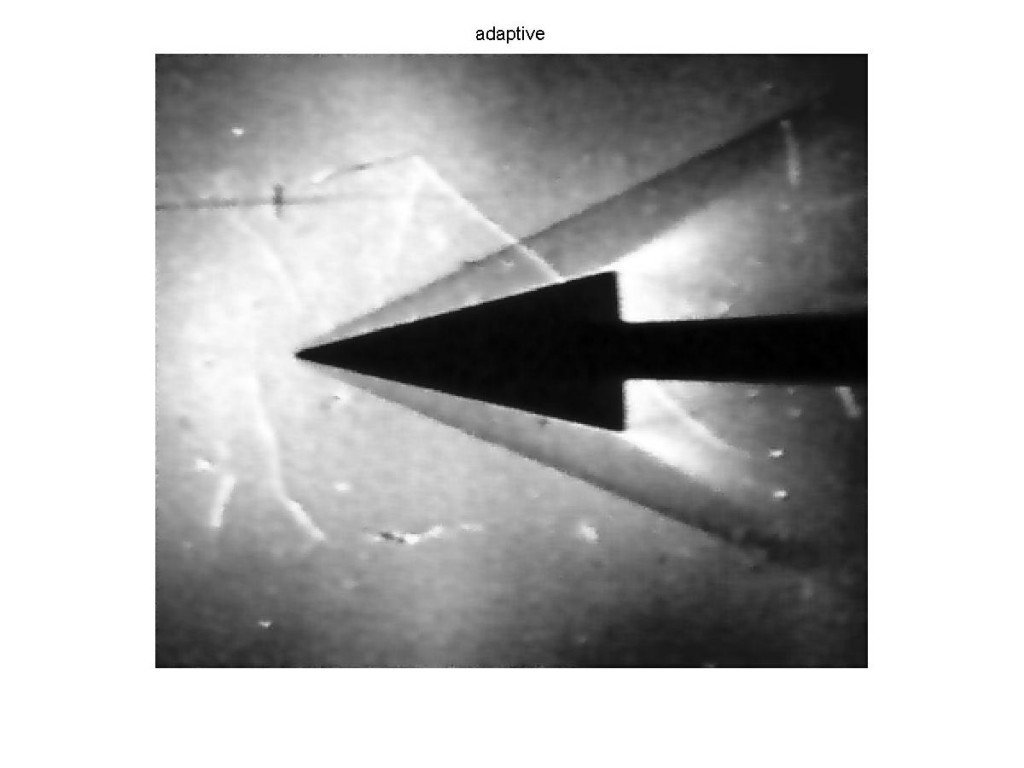
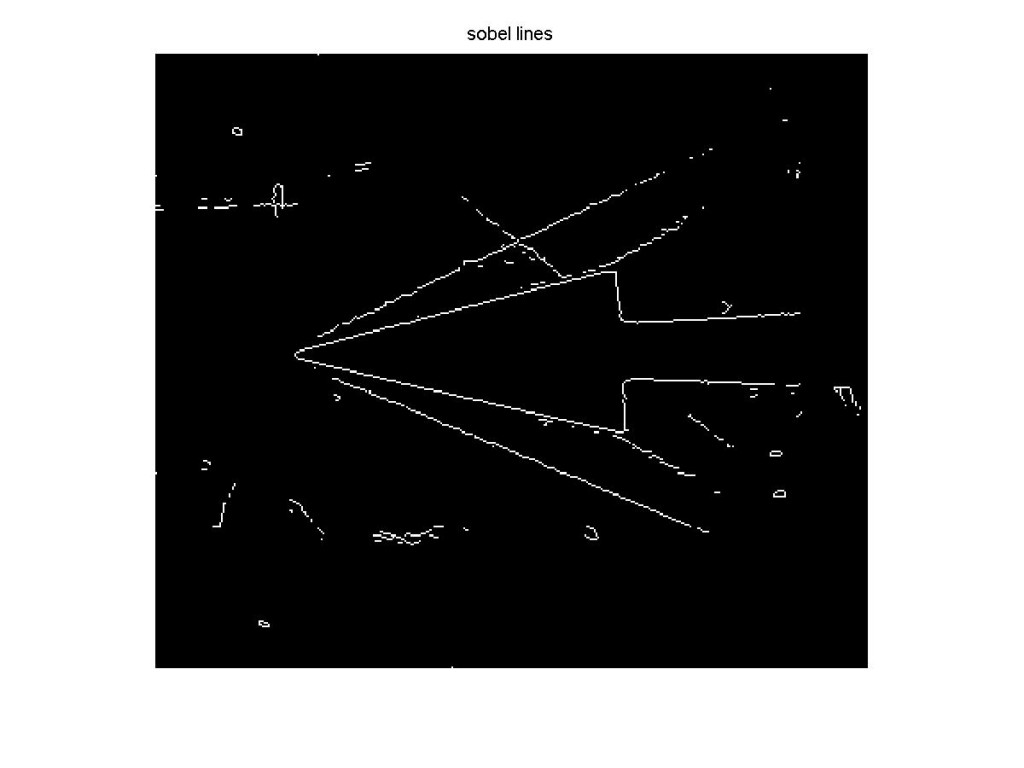
The following project spawned from a simple homework assignment. The purpose of the assignment was to identify the angle of the shock-wave formed on an object. Provided were photographs from the schlieren visualization lab that we had done the previous week. What I have written is a matlab script that finds the finds the shock-wave and draws a line on it. From the beginning and ending points the angle can easily be discerned. What follows is the progression of images produced as the various processes and filters are applied to the image.

Grayscale + Contrast

Grayscale + Contrast

The image is first converted to grayscale. The contrast is then increased.

Smoothing

Smoothing

The increased contrast has also made the image more grainy. The image is smoothed using and adaptive filter to reduce the number of fake lines that will be detected in the next step.

Edge Finding

Edge Finding

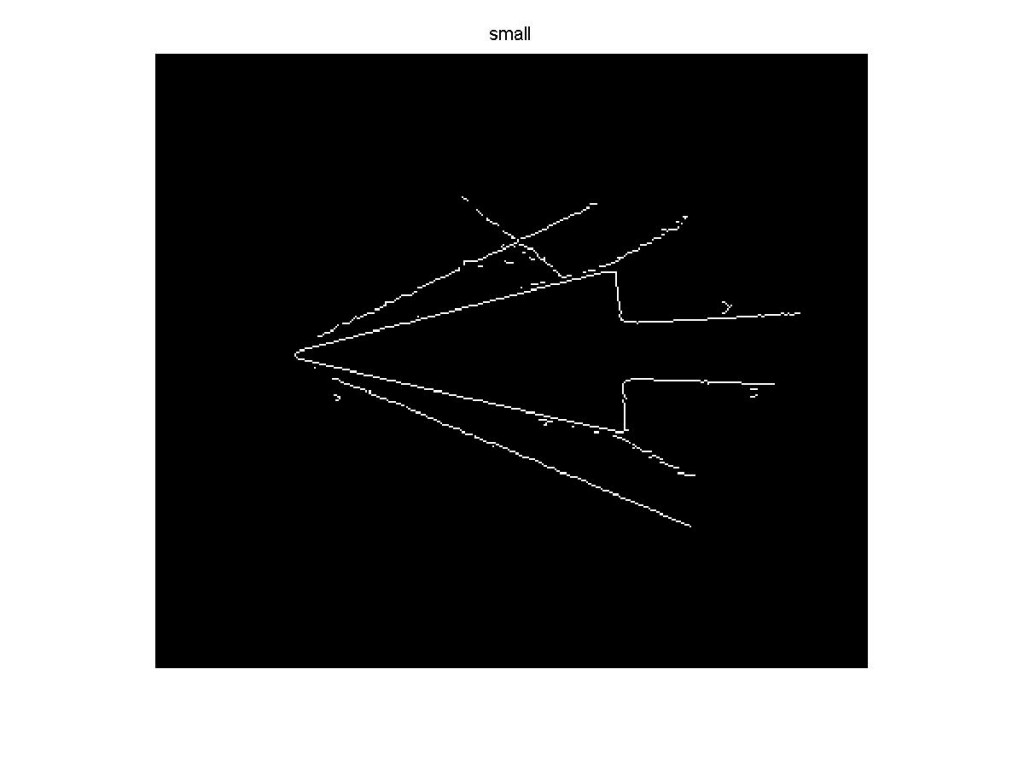
An edge finding algorithm is applied which looks for sharp changes in the color of the image. This creates a binary image (black and white) where only the edges are shown.

Merge Lines

Merge Lines

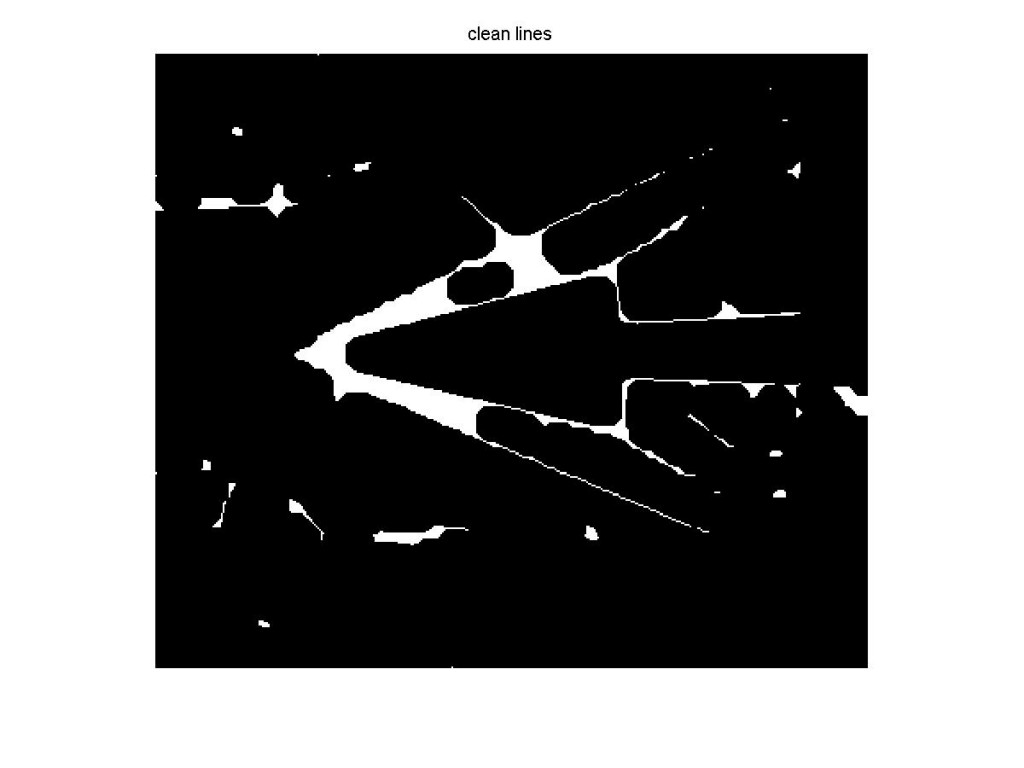
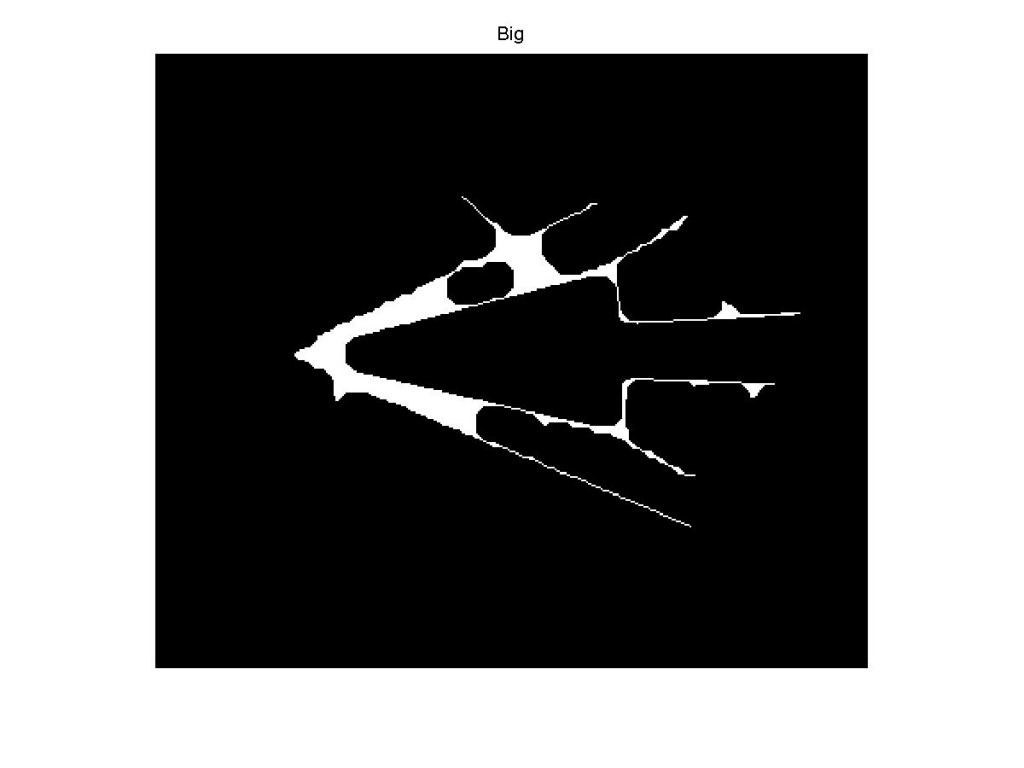
In this step we want to retain the object which created the shock-waves as well as the shock-waves. The object has an unbroken outline making it the largest contiguous object in the image. We also know that the shock-wave will be mostly contiguous and will importantly come very close to the object. A region closing algorithm is applied to the image which causes the regions to expand and merge together.

Isolate Large Object

Isolate Large Object

Now the largest contiguous region can be selected from the image.

Line Fragments Filtered

Line Fragments Filtered

This is used as a filter against the image from step 3.

Hough Transformation to find Lines

Hough Transformation to find Lines

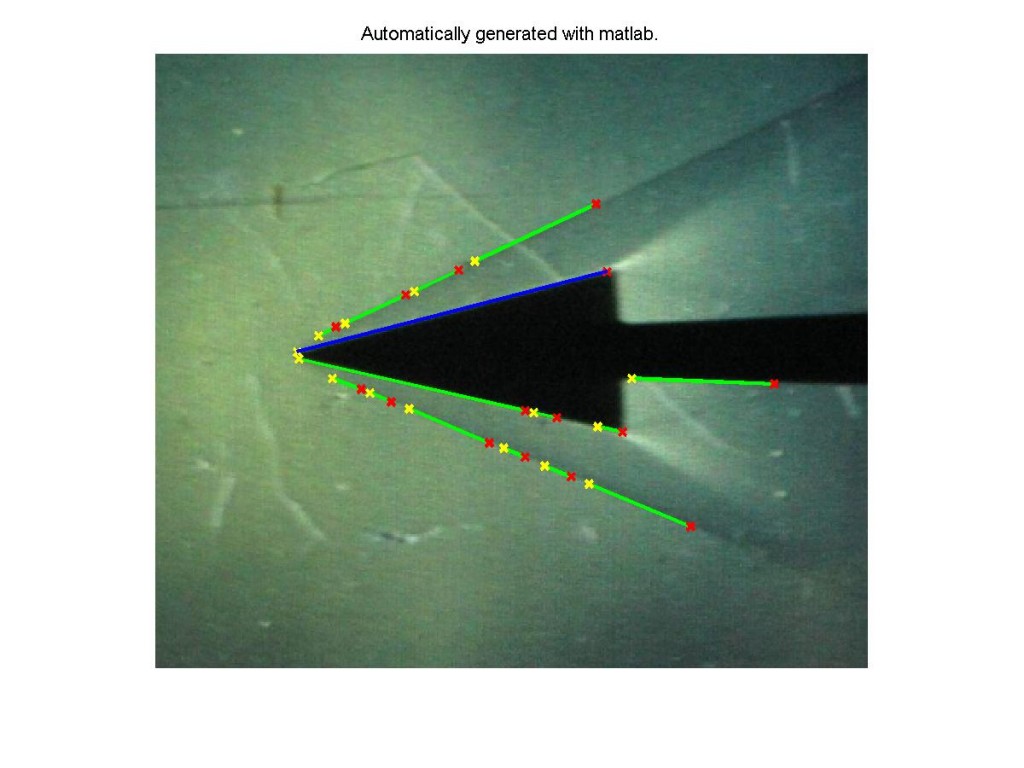
At this point a hough transform is applied to the image. From this the “houghlines” function extracts end-points for lines. Finally this data is over-layed on to the original image.  There is also a bit of code at the end for collating multiple lines along the same feature into a single item on a list.  The plan was to use this list to find shock-waves and their angles.

There are a number of areas where this experiment could be expanded. Importantly, the algorithm needs to run against other images to in order to tune out oddities that are likely to occur. The code itself could be generalized so that it is easier to hand it new information. The data generated could also be processed better to amalgamate discontinuous lines. This was started, but never completed. There is also the possibility of adding a method to cut-out the object that generated the shockwaves from the images. This could be useful for reducing the irrelevant lines that are generated.

I have appended the original code I used for this below.  Be advised that the code is very rough in spots and has no comments.  This code will not work without matlab’s image processing libraries.

Matlab Shockwave

Upcoming Project: Variometer

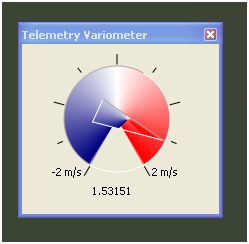
I’ve started working on my next project, a telemetry based variometer.  A variometer is commonly used by glider pilots to monitor the rate of climb of the aircraft.  The Piccolo autopilot provides the operator with altitude information, but does not exploit this to data to the full extent.  The plug-in that I am working on will include compensation for total energy and for the intrinsic sink rate of the aircraft (if sufficient information is provided by the operator).  This will make it easier for an operator to determine if the plane is in rising air during thermaling maneuvers.  It will also eliminate the need for a separate variometer system to be installed in the aircraft.

VarioProto

Above is the latest screen-cap from the variometer prototype.  The device is nominally functional, but it far from finished.  The to-do list includes user configuration options, audio indications, and ascetics.  Adding the audio feedback will be a rather interesting feature, although it may be dropped from the initial release of this plug-in.

WattMeter V1.0

I am glad to announce that the first version of my WattMeter plugin for the Piccolo Command Center is now ready for release!  It is my intention to make this software available as freeware.  However, ITAR restrictions prevent me from simply posting it online for anyone to download.  I hope to find a solution to this problem in the near future.

The WattMeter plugin is a tool for advanced battery management.  Using the analog inputs on the Piccolo autopilot it is possible to feed live current and voltage readings from an external device in to the PCC.  However, to be useful the readings must be calibrated to actual units (volts and amps).  In order to do this live on the flight line, this plugin was created.

Display:WattMeter1_Display

With the voltage and amperage data collected it is possible to further manipulate the data to determine wattage and watt-hours drawn.  If the watt-hours capacity of the power source is known then the reserve capacity can be determined as well as an estimate of how long it will last.  This data is derived using the variables defined in the configuration panel which have automatically been loaded.

It is also important to note that the integration of the watt-hours starts as soon as the plug-in is loaded.

Configuration:
The “Configure” button on the display panel launches the configuration panel which gives the user complete access to the calibration variables.  This version of the WattMeter allows the user to select which of the four analog inputs to use as the data sources.  The relationship between the voltage/current and the readings is assumed to be linear.  Therefore the slope and intercept variables are all that is needed.   The section marked “Power Source” contains the maximum capacity of the power source as measured in watt-hours.  This variable can be changed at anytime without effecting the integrity of the data.  When the “Save” button is pressed, all settings are saved to disk as well as applied to the on-going calculations.  Note that an adjustment in the sensor calibrations will not be applied retrospectively to the data.

WattMeter1_Config
Menu:

Upon launching the PCC the display panel will not be visible.  To view the display panel simply click the new “WattMeter” menu item under “Window”.

WattMeter Menu Item

WattMeter Menu Item

Blank Slate

Hello All,

First of all thanks for visiting my humble little corner of the web.  I am still setting up the server, but everything should be working soon.

There are a number of projects that I hope to unveil in the near future.  The first project will be the WattMeter plugin for the Piccolo Command Center.  The project started out a simple proof of concept to show that plugins could be written for the PCC.  Below is a screenshot from the first draft of the WattMeter.  It had no features beyond what you see. All it did was report the voltage, amperage, and wattage calculated from hard-coded values.

This is a screenshot from the first version of Wattmeter.

Return top